
Everything Online All at Once: Making Blogging Work for Creative HE Students
Roo Pescod
Download the PDF of this article
ISSN 2752-3861
Abstract
The COVID-19 pandemic of 2020 precipitated a heightened interest in online tooling for higher education (HE) in an attempt to reimagine existing teaching and learning into digital spaces. Predominantly an art, design and media institution, Falmouth University’s (FU) digital toolbox, like many universities, grew and diversified rapidly to accommodate innovative teaching practices at a distance. In this article, staff from FU’s Digital Learning (DL) team reflect on the experience of redeveloping the institution’s student blogging platform (Journal) which hosted a 900% increase in student sites in the first year of the pandemic.
To achieve this, the team reinvented the way that Journal was offered to staff and students, creating and testing a range of templates, reimagining student guidance, and responding dynamically to the needs of practice-based subjects with abruptly restricted access to resources and facilities. The associated challenges and solutions are described in detail, along with the successes and lessons learnt.
Feedback is included from student users, which fed into an action plan for future developments and ultimately informed a 5-month observational experiment which investigated how best to provide technical guidance to students. This experiment and its results form the second part of the article, in which technical guidance is shown to be a vital aspect of creating an equitable learning environment in online spaces. Persistent assumptions about high levels of digital literacy in HE students are challenged, existing case studies of blogging in HE are consulted, and multi-disciplinary literature is aggregated to investigate different methods of guidance delivery.
By documenting the challenges and opportunities of educating in a pandemic, this case-study demonstrates wider lessons for the future of the HE sector as it increasingly incorporates online learning and tools into its pedagogy.
Part 1: Falmouth Journal during the COVID-19 pandemic
New digital tools
The COVID-19 pandemic of 2020 precipitated a heightened interest in online tooling for HE in an attempt to abruptly reimagine existing teaching and learning into digital spaces. This sudden shift to online learning was exhausting for researchers and students alike (Herman et al., 2021). FU’s digital toolbox, like many universities, grew and diversified rapidly to accommodate innovative teaching practices at a distance. In many HE institutions, new tools were hastily procured or repurposed to reproduce traditionally on-campus activities online. FU specialises in creative industries subjects, creating specific and varied challenges reflecting the different formats that students work in, including performance, physical art, architecture, business, game design, etc.
The HE sector should never become averse to embracing new technology, but mass procurement comes with associated risks and challenges; such as time-intensive staff training and creation of support documentation. Data compiled during the pandemic suggests that the percentage of individuals’ time spent on university activities decreased in most cases and yet students and academics were expected to complete the same amount of work while seamlessly incorporating these new technologies (Herman et al., 2021).
It is also relevant to reflect that, as tempting as procurement can be, new software rarely results in innovation in itself. Existing tools can often be re-examined and re-purposed to yield more exciting benefits for lower cost in money and time.
FU’s Digital Learning Team took a measured approach to procurement, seeing a lot of success with a few new tools which enhanced teaching and learning, which will continue to be used going forwards into the post-pandemic world of blended learning. Regardless of the pandemic, FU had a particular interest in developing its digital toolkit as FU’s 2030 strategy projects an ambitious increase in off-campus students through their growing suite of online-only courses (Falmouth University, 2020).
Unsurprisingly, by spring of 2022 FU was auditing some of its new tools due to lack of academic take-up, or unforeseen limits to functionality brought on by a decreased process of scrutiny. In contrast, one existing tool that undertook huge growth and was successfully incorporated into learning and teaching activities both during the pandemic and going forwards was FU’s academic blogging platform Journal.
What is Journal?
Use of blogs in HE has been long proven to be an effective environment for social constructivist learning (i.e., students learning from their interaction with culture and society), utilising discussion forums, e-portfolios and group blogging spaces to facilitate reflection, peer engagement and collaboration (Angelaina and Jimoyiannis, 2011:170-171).
FU initially purchased Journal in 2017. Journal is FU’s name for CampusPress, an academic version of WordPress which in turn is an open-source content management system that powers over 40% of all websites (W3Techs, 2021). The platform enables students to build websites, blogs and portfolios as educational artefacts in a secure environment. It additionally offers custom functionality for use in higher education, e.g., student sites can be attached to ‘classes’, giving academic staff admin control over whole modules, including the ability to revoke student editing rights after a deadline.
Prior to the pandemic, Journal hosted around 300 FU student blogs, and had historically been unpopular with students and course leaders alike due to the complicated requirement for students to create and customise their own blogs and manually connect them to classes. Improvements were occasionally discussed, but development time for an unpopular tool was never a priority of the team. However, this changed with the pandemic, when an academic request for a platform to facilitate a portfolio submission online provided a catalyst for the DL team to explore ways to simplify these processes. Fortunately this coincided with increased capacity within the team ahead of the planned and postponed (due to COVID) growth of FU’s online portfolio.
This exploration yielded the ability to pre-design and bulk create multiple Journal sites for students, meaning that when each student logged into Journal for the first time, a customised blog would be waiting for them, already attached to a class, with the correct page headings corresponding to their assessed work.
After designing a template, two members of the DL team ran a teaching session with students to introduce the platform and how to use it. As soon as the session was underway the limitations of this approach began to become apparent. The session took over an hour, and with the academic in attendance became as much about the assessed task as an introduction to the technology. Not all the students showed up, and although the session was recorded, the academic subsequently requested that the recording be cut down to short videos demonstrating specific tasks. This was the first indication of how important the role of guidance would play in the implementation of Journal, and how inextricable it would become from the use of Journal going forwards.
Despite proving time consuming for the DL team, this initial Journal was a success and was presented to the whole institution at FU’s Core Academic and Technical Training week (CATT). Due to the widespread teaching challenges of the pandemic, this led to a huge and varied demand for Journals to be in place for September 2020. Three full time Learning Resource Designers responded individually to the creative ideas of academics in different disciplines, leading to a chaotic but creatively fertile period. In this mad rush some problems were solved in multiple ways, and staff time was so stretched that proper scrutiny was not always given to the learning design of tasks for which Journal was used.
During this period, a conscious effort was made to explore the available WordPress plugins to address some course-specific requests, such as improved galleries, and more interesting functionality for sound and video. But despite the many available plugins, the most successful solutions tended to emerge from adapting learning activities to suit the technology. Instead of creating technologically advanced sites, the team eventually drilled into the multiple teaching possibilities of relatively simple designs.
In total, FU’s Digital Learning team created 2000+ new student sites across 40+ modules in time for Study Block 1 in 2020. Three main templates emerged as having multiple functionalities, being adaptable to most use cases. The following made up the Digital Learning offering.
Online Portfolios / Individual Sketchbooks
Each student had an identical individual Journal, bulk created and attached to a class. A large image gave simple module branding by tying the theme into FU’s Virtual Learning Environment (VLE) Moodle, or allowed simple but visually impactful customisation for students to personalise their Journals.
Separate pages were often used for specific pieces of work or split into weekly tasks. The WordPress theme Twentyseventeen allowed front-end editing, reducing student’s interactions with the WordPress dashboard, thereby simplifying the student experience. Every Journal had a link back to the relevant module page on the VLE to streamline the student experience as much as possible.
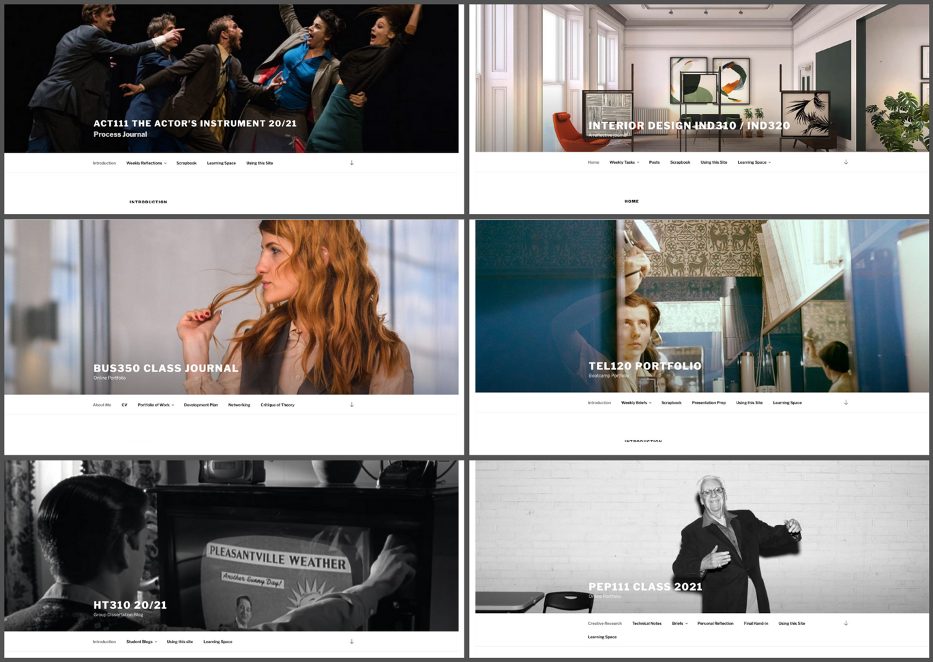
Collaborative Scrapbooks / Multimedia Forums
This collaborative template enabled every student to contribute to the same Journal blogging site throughout the study block. This was great for sharing ideas, completing open weekly tasks, and facilitating peer review by commenting on each other’s posts.
Although the VLE had its own forum capabilities, this template allowed visual customisation and rich media sharing capabilities. This was regularly used for embedded YouTube videos, links to interesting articles and draft work uploaded for peer review.
By offering a shared space for a module cohort this template aimed to help to create and maintain a sense of community, long understood to be important for distance learners (Conrad, 2005).
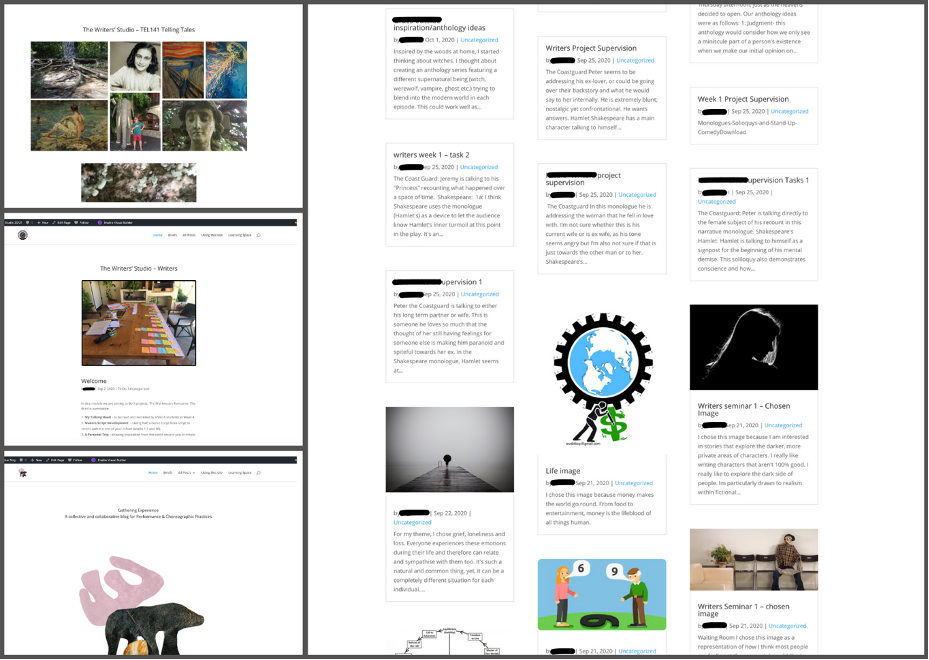
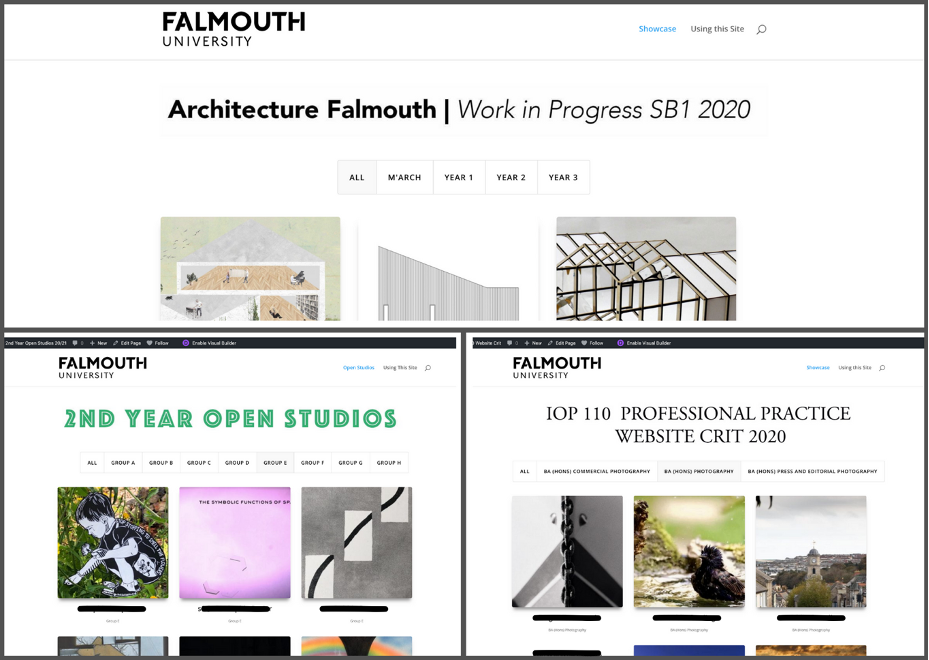
Class Exhibitions / Showcases
Another collaborative template was generally used to enable students to showcase and share finished work within a course or department. The design of the template aimed to be cleaner than the scrapbooks, leading to a ‘finished’ look.
Each student generally had one post labelled with their name or work, which they were responsible for populating. Posts were often categorised to allow useful filtering by year, type of work, or project group. This template was used variously within single modules, or across multiple years of a course.
Developing support & resources
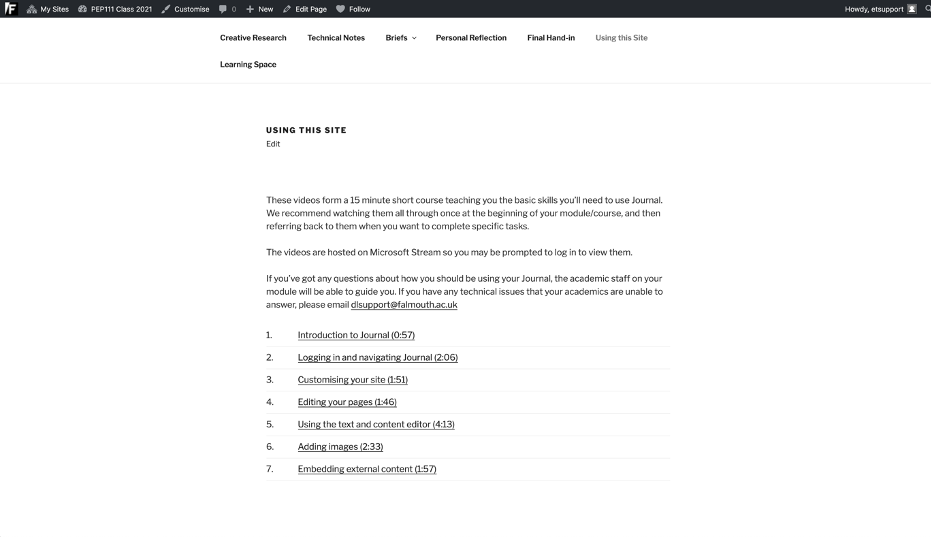
Learning from their challenging experience of delivering guidance, the DL team created an adaptive short course of videos totaling about 15 minutes, which explained how to complete specific tasks in Journal. These were embedded on each individual and collaborative student blog in a page called ‘Using this site’.
Videos could be mixed and matched depending on how different templates worked, but many journals required custom videos due to their custom functionality. The plan was that this would replicate the introductory session given to the pilot class and be easy for students to find when they needed them.
Interestingly, student feedback and video view counts proved this method of providing guidance unsuccessful at reaching the majority of students. This will be investigated later in this article in detail, but this evidence further proved the importance and difficulty of providing this guidance effectively.
While efforts had been made to ensure course teams were confident using their newly created sites, there was a large increase in the number of support requests through the DL helpdesk. Some staff and students were clearly struggling with the platform, despite the thorough guidance that had been created.
Unforeseen issues
Despite a lot of effort going into planning, the project inevitably suffered some unforeseen issues.
Unknown to the DL team, when a new student site was created the system automatically emailed the student with a username and password – which didn’t work. This was difficult to diagnose until the start of term when around 2000 confused students got in touch with the DL helpdesk.
Not enough consideration was given up-front as to which kinds of staff needed access to the student sites. Initially it was assumed that the module leader and other teaching staff would suffice, but a steady trickle of requests to be added persisted for most of the term from Senior Technicians, Course Leaders and Student Advisors. This was a time-consuming process which could have been managed better from the start.
The creation process had been frantic enough that aspects of digital accessibility had been taken for granted. Whilst accessibility had been at the forefront of VLE activity through the pandemic, assumptions had been made about the accessibility of Journal. Fortunately, and frankly by chance, all the themes used by the DL team met WCAG 2.1 (the current Web Content Accessibility Guidelines) accessibility standards. It was a narrowly averted misstep, and a lesson learned. Since launching, all non-accessible themes have been disabled in-line with FU’s accessibility statement for the service.
Once sites were live, it quickly became apparent through informal staff feedback that some of the Journals were more complicated than they needed to be. On reflection, a lack of scrutiny and the team’s enthusiasm to show off what Journal could do had misinformed some design choices, and in these cases what students were being asked to do was too prescriptive or unrealistically complicated.
Some of these oversights arose from assuming that students would use their blogs almost like an exercise book, completing weekly tasks in pre-determined pages. This worked in theory, however in retrospect a lot of students felt like Journal was yet another system that they had to learn during the pandemic, and the heavier the cost to their time, the less likely they were to engage. For collaborative class journals it was possible to make changes after launch in response to student difficulties. Unfortunately, this wasn’t possible for large courses with individual blogs, and in a few cases staff quickly abandoned Journal, or students opted to use different systems instead.
From informal staff feedback, the DL team pieced together that there was a strong correlation between student satisfaction with Journal and staff confidence in using the tool. Staff who were less confident with the tool were less able to support common queries, which negatively affected the students’ perception of the platform.
Some students were using multiple types of Journal across different modules and were confused by apparently conflicting guidance. This was an unanticipated drawback of having multiple templates working in different ways. The lesson here was that where possible, Journals should work within a transferable logic; removing ‘clever’ unique functionality in deference to simple, basic templates. However isolated they seemed behind logins and private permission settings, no Journal existed in a vacuum.
The later Journals that were requested, once Study Block 1 (SB1) was underway, were mostly built as very stripped back sketchbooks with little customisation or prescriptive expectations of use or were collaborative showcases/mid-term exhibitions with very simple and clear guidance. These evolved templates were informed by the mistakes and difficulties experienced early in SB1 and benefitted hugely from that hindsight.
Student feedback
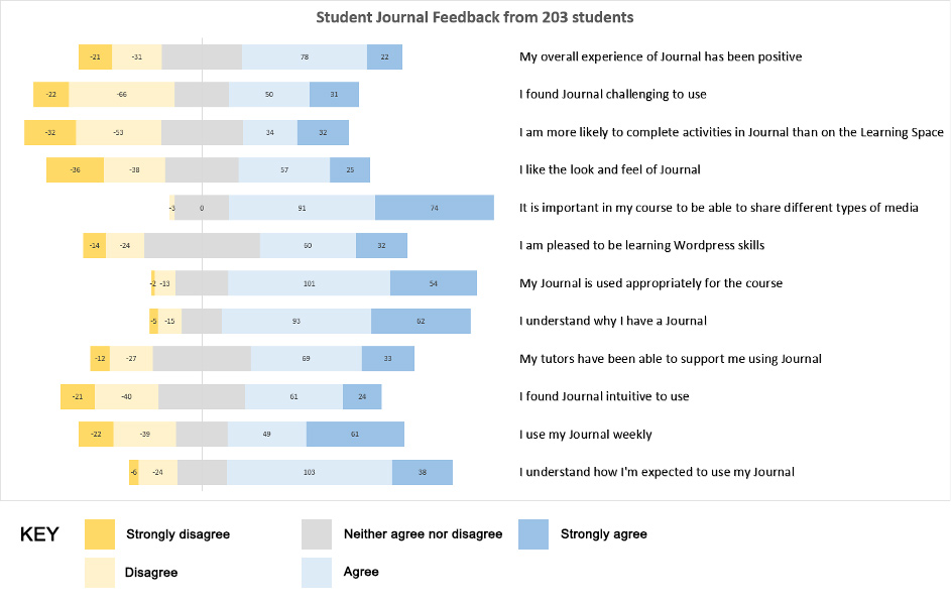
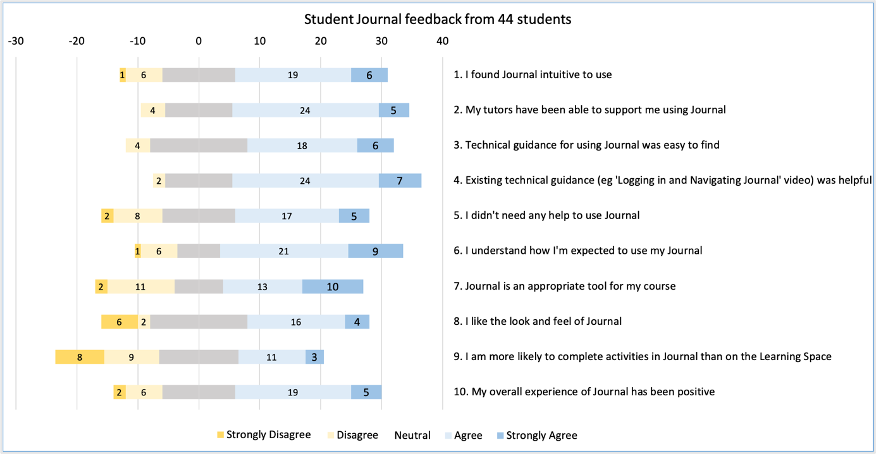
Towards the end of SB1, an online survey was circulated to all students who had been using Journal. The feedback from 203 out of 2000 students was mixed, but under the circumstances of the pandemic and unprecedented disruption of HE, it seemed encouraging.
Scaling questions returned positive responses to all questions, although some were closer than others. In the results this is illustrated mainly by a prevalence of blue ‘agree’ and ‘strongly agree’ responses with the flipped exception of ‘I found Journal challenging to use’. This questions shows a close split of 81 students (40%) agreeing the platform was challenging to use compared to 88 (43%) disagreeing, and a similar close split was true of how it looked and felt to use. However, a clear majority of students understood why they were using Journal, felt it was used appropriately for their course, and understood how they were expected to use it. Smaller majorities were pleased to be learning WordPress skills and reported using their Journal weekly.
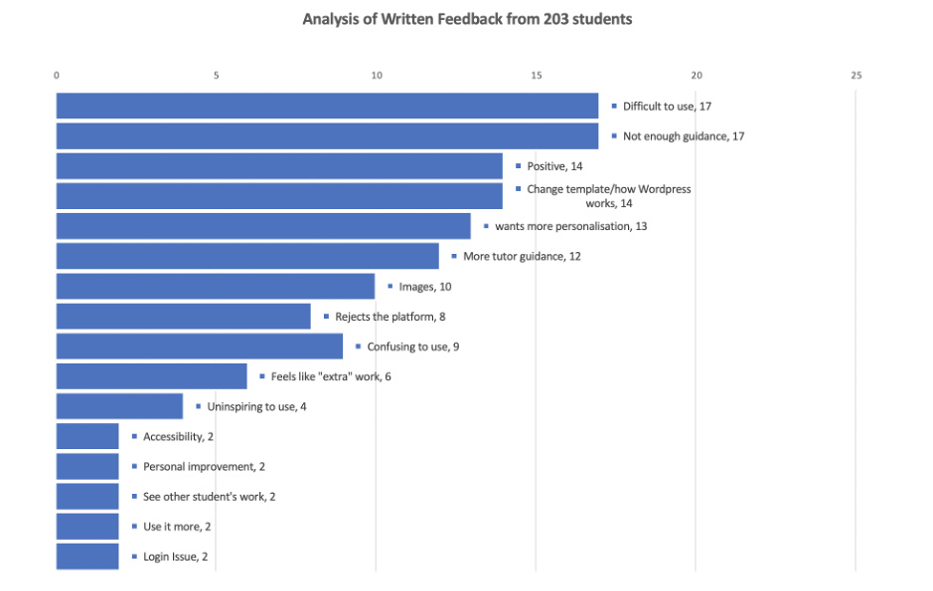
An analysis of the written feedback was more concerning, but full of useful insights. By coding the feedback into common phrases and themes, it was clear that a significant percentage of students felt that Journal was difficult or confusing to use, with not enough guidance to support them. The coding was achieved by picking out instances of recurring phrases, distinguishing between subtle differences such as the platform being described as difficult, confusing or uninspiring to use. In truth ‘difficult’ and ‘confusing’ could arguably be combined along with ‘not enough guidance’ to create a single category of 43 responses, but the specificity of the responses was maintained to preserve the student voice.
Similarly, ‘change template/how WordPress works’ and ‘wants more personalisation’ could both be read as students requesting a different platform, which although useful was not actionable at the time. The distinction between ‘Not enough guidance’ (platform) vs ‘More tutor guidance’ (task) is revisted and discussed in more detail later in this article.
Importantly, most of the existing guidance videos had less than 100 total views – out of 2000 student users. This clearly indicated a disconnect between how guidance was presented and where students were looking for it. The feedback also justly highlighted some areas where the guidance was inadequate. For example, multiple students asked for more detail on using images, and specific information about using Journal on mobile devices.
Finally it highlighted, as expected, that some Journals were too complicated, and urged simplification. Coupled with examination of DL helpdesk tickets through the term, it was evident that students found one method of editing sites – creating new posts, instead of editing existing pages – generally more intuitive.
Part 2: Where should guidance be hosted?
In Part 1 of this article, it was explained that new guidance videos had been created to asynchronously support students to navigate their own way through using Journal. The aim of the video guidance was to teach use of the tool with as little bespoke time investment as possible, and to reduce the burden on academic and support staff of providing ongoing ad hoc technical support. However, as the view counts and survey results above show, it became apparent that only a very small percentage of students had accessed it.
The survey results indicated that students wanted and needed exactly the type of guidance that had been created, but they were largely unaware that it existed. This research suggested that it was not enough to create good quality guidance, it also needed to be delivered to students with a considered approach. With one eye on FU’s forthcoming online only courses, this in turn raised the question of how technical guidance for new online tools should be integrated into the delivery of modules.
Literature review
A literature review was undertaken around the intersection of student information seeking behaviour, promotion of information resources, and creation of effective online learning pathways, however on deep examination the question of where guidance of this type should be hosted exists in the blank spaces between these fields. There is a gap in the literature surrounding practical methods of delivering online technical guidance in HE, apparently because it is often deemed unnecessary to provide any.
The literature around using educational blogging platforms for teaching tends to assume that students will find the platforms easy to use (Angelaina and Jimoyiannis, 2011; Mattia, 2015; WP Pluginsify, 2019), thanks in part to the problematic myth that all students and young people are inherently proficient with technology (Williams et al., 2008). However, studies show that students often struggle with the technical aspects of educational blogging, leading to feelings of stress, increased difficulty of tasks, and depleted motivation and inspiration (Sharma, 2008, Adhikari, 2019).
Digital literacy cannot be assumed to be inherent in HE students. Not only are they a culturally diverse group, but higher internet usage does not necessarily indicate a higher level of digital literacy (Oblinger and Hawkins, 2006). In order to develop self-efficacy amongst users, according to UTAUT (Unified theory of acceptance and use of technology), technical guidance must demonstrate that blogging is sufficiently straightforward, but in addition, the visibility and existence of the guidance is important in and of itself (Venkatesh et al., 2003:450-454).
Information seeking models suggest that students will search for guidance if they feel they need it (Bawden and Robinson, 2012:205) but will tend towards the easiest route to knowledge and show a disinclination to explore further (Williams et al., 2008:163).
Guidance should be hosted in a way that is comfortable to internet users, not just experts in University systems, by making use of conventions of the wider web (Lanclos, 2016). Video is a preferred format for guidance as demonstrated by massive YouTube usage (Think With Google, 2018). Video also makes platforms visible and ‘welcomes’ students into digital university spaces (Lanclos, 2016).
Delivering guidance at the point of use is potentially effective – helping them “continue their journey without slowing down” (Potter, 2012:2) – but too-targeted marketing of resources walks a tight-rope of not actually raising their profile or being annoying to users as notoriously proven with Microsoft’s intelligent office assistant Clippy (Swartz, 2003). Additionally marketing resources indirectly to stakeholders such as academic and support staff can help to mitigate this (Priestner, 2012).
Good learning design should incorporate instructions within the task, but care should be taken not to confuse task instructions (‘what’) with technical instructions (‘how’) which could lead to confusion and reduce the benefits of reflective activities (Korthagen, 1999). Subject experts may not be platform experts, and therefore transferable subject-generic technical guidance has practical (Rumble, 2001) as well as pedagogical benefits (Salmon, 2002).
Most of all an ethnographic approach should be taken to determine what students need, to understand the target audience and how they use resources rather than relying on ‘expert intuition’ (Borg, 2016; Lanclos, 2016; Matthews, 2009; Potter, 2012; Ramsden, 2016).
Methodology
Experiment
From the literature, a variety of approaches were identified to connect students with information that they need, and for practical purposes these can be broadly categorised into three different ways of thinking about the video guidance:
- Information to be searched for and found by the student.
- Information resources to be marketed to the student.
- An essential part of a course of study, included in the teaching.
An experiment was designed to provide three distinct pathways to the same short course of videos, designed to reflect these different approaches. The short course of videos was duplicated for each pathway, allowing the success of each pathway to be assessed by the number of views each video achieved at various stages of the study block between modules going live and the final submission of work.
To supplement this quantitative experiment, an online survey was circulated to aid the interpretation of the collected data. By collecting limited data, in this case monthly anonymous view counts of videos over a 5-month study block in 2020, the experiment builds up a real picture of student behaviour. By comparing this data between different pathways, it was possible to compare the success of each pathway.
Scope
The case study focused on 8 modules, with a total population of 196 Falmouth University students. The sample represents a mix of undergraduate and postgraduate modules across a range of creative subject disciplines within Falmouth University. To preserve the integrity of the experiment the sample was limited to modules whose students had not used Journal previously, and by academic staff who were willing to incorporate unmodified pathways into their modules. Students were unaware of the observational experiment, and no additional data was collected in this stage of the experiment.
Development of guidance pathways
Three pathways evolved from the key themes identified within the literature, and these were mapped onto FU systems creating three distinct user journeys to access the same video guidance.
- Literature on information seeking behaviour informed Pathway A, in which students identify an information gap and look for guidance.
- Literature on promotion of online resources in HE informed Pathway B, in which packages of targeted guidance were delivered at the point of use.
- Literature on good practice in online learning design informed Pathway C, in which a concept-checking quiz was incorporated in the teaching of the module on the VLE.
Each module included in the sample had access to all three pathways, which were hosted on university platforms at different stages throughout the student journey of using Journal.
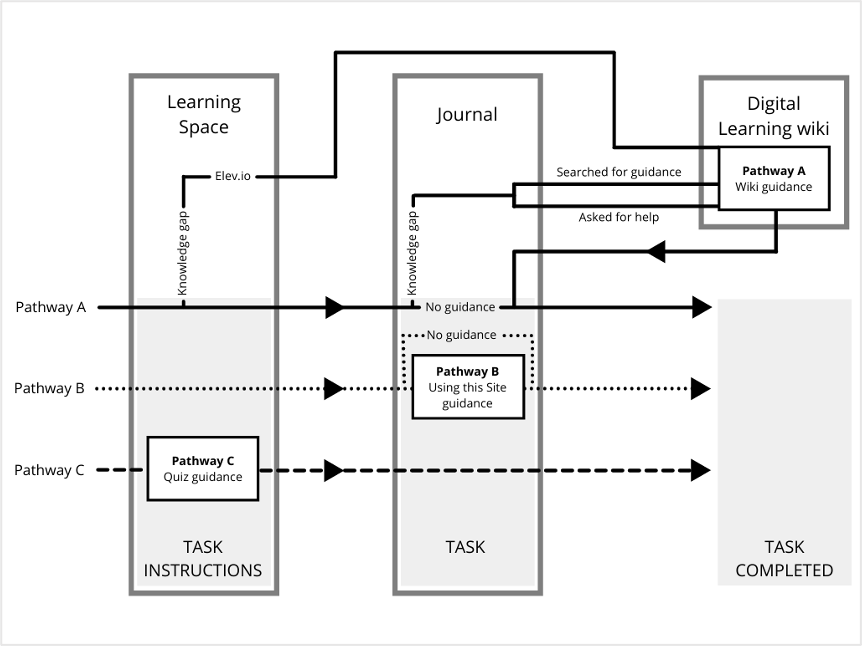
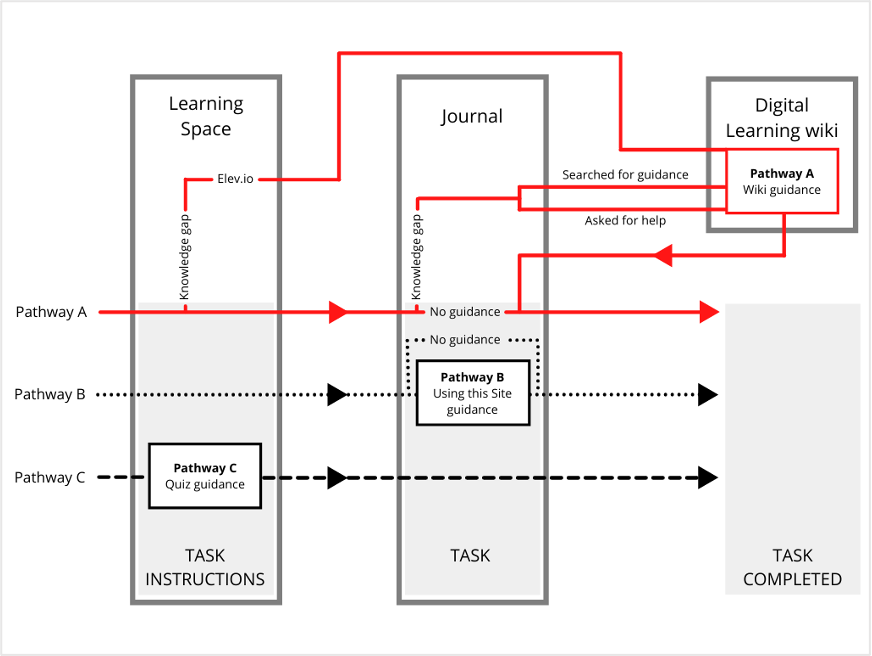
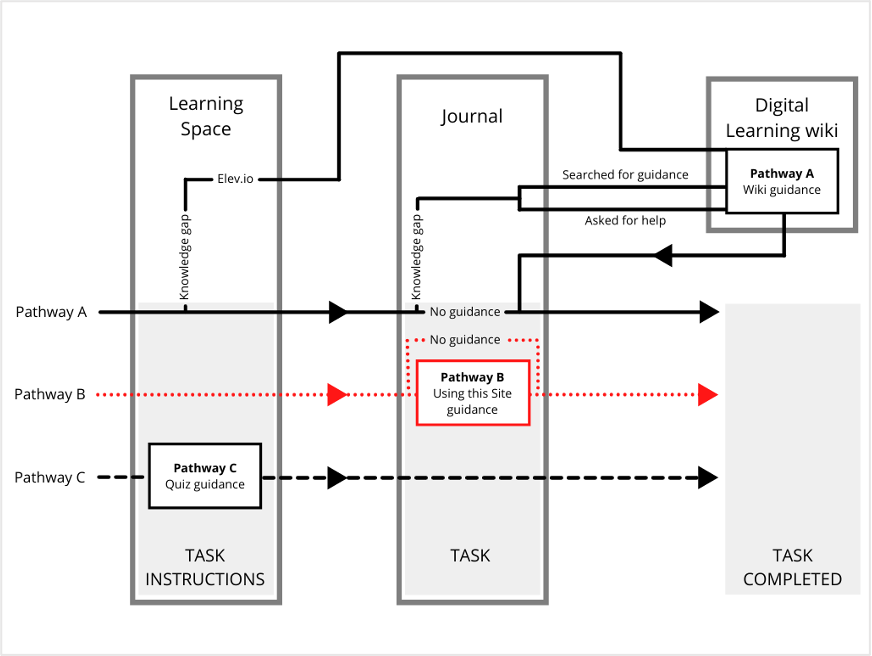
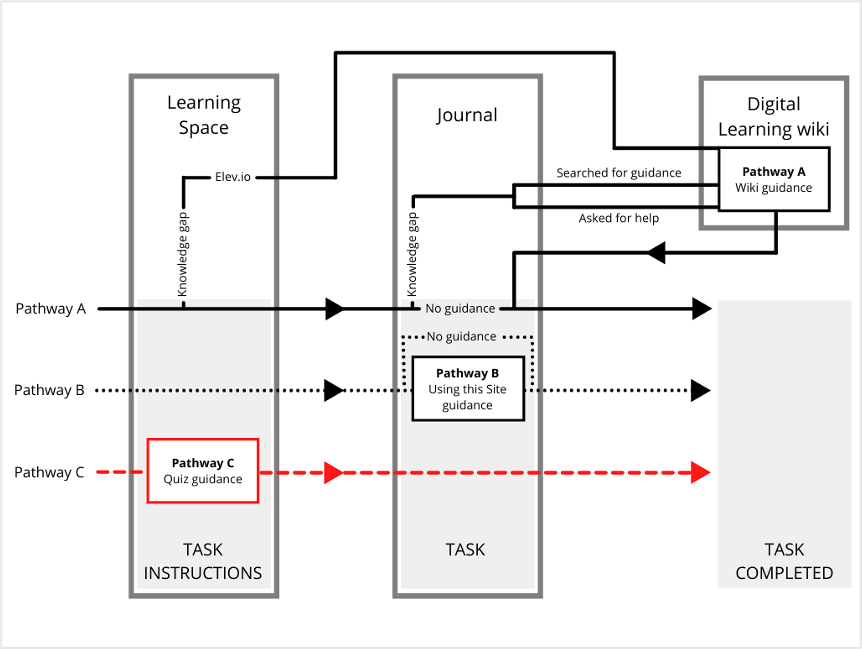
Figure 7 represents possible student journeys coinciding with each of the three pathways, illustrating the various points students could interact with the guidance across the different platforms. This journey begins at the point that task instructions are given (in FU’s VLE ‘Learning Space’), continues through performing the task in Journal, and ends when the task is successfully completed.
Pathway A – Wiki guidance
Pathway A is a page on the DL wiki, titled Journal Short Course for Students. The wiki is the primary resource for technical guidance for all digital University systems, where staff and students are often signposted.
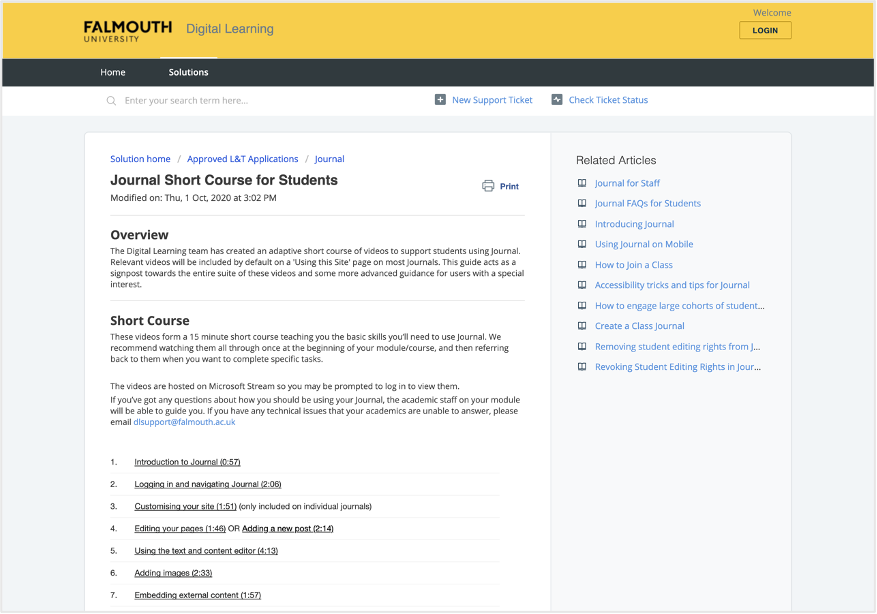
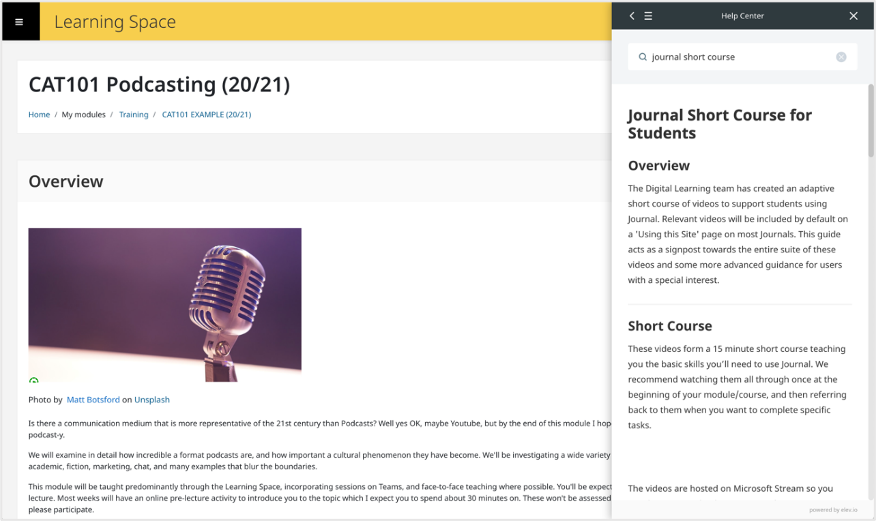
A link to this traditional guidance is embedded on the Journal homepage, and this is often where students are referred to if they contact the IT team or the DL helpdesk. This guidance is also transposed into Learning Space using third party software called Elev.io, providing a searchable sidebar (shown in Figure 9).
Pathway B – Using this Site guidance
Pathway B is hosted on a dedicated page within every student blog titled ‘Using this Site’.
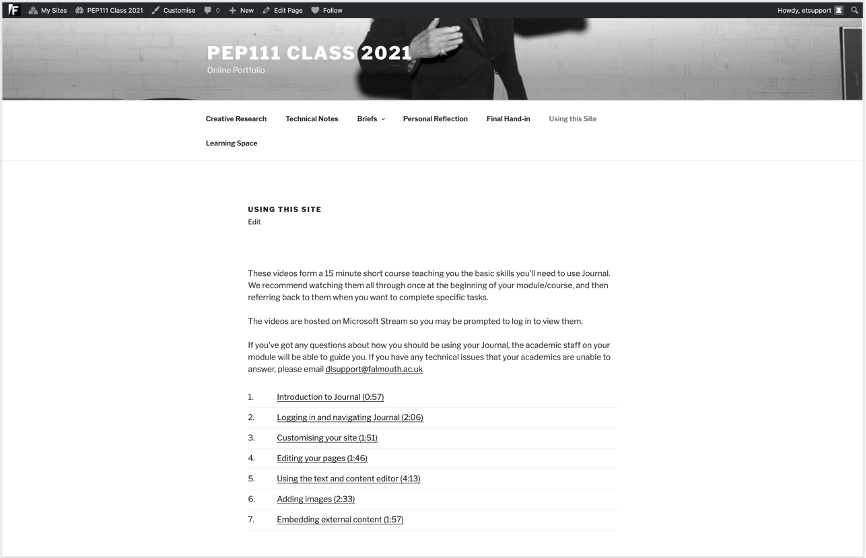
Due to being situated within individual journals, Pathway B allows higher levels of customisation than the other pathways.
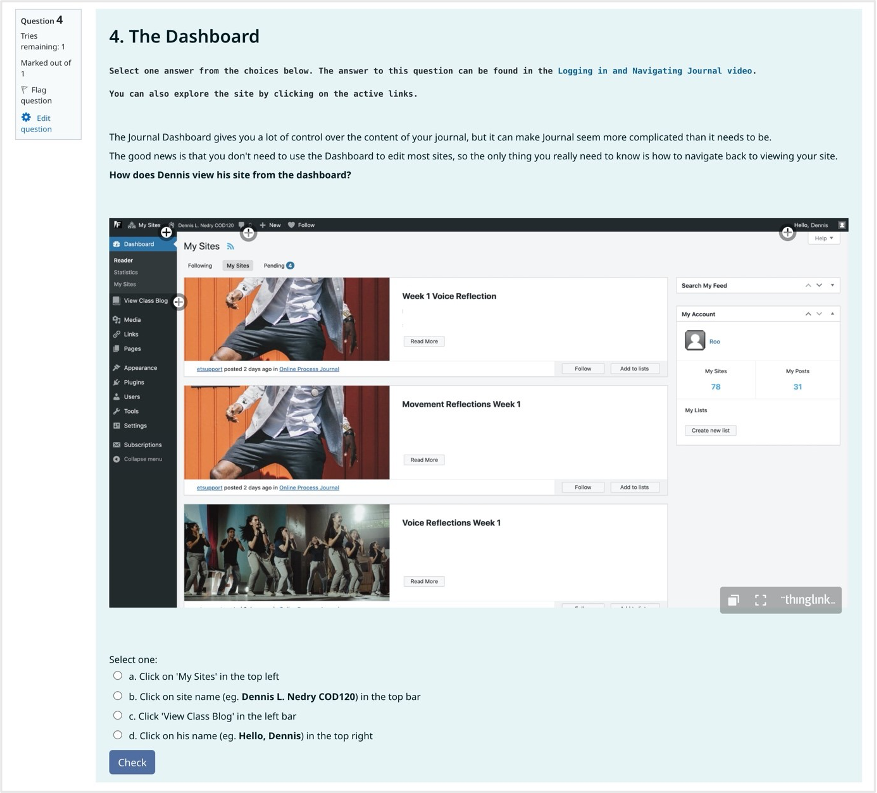
Pathway C – Quiz guidance
Pathway C is a concept checking quiz embedded in FU’s VLE. Videos are provided as part of the learning journey of the module, within a familiar format of a VLE quiz which is enriched with various question styles, annotated images and interactive external tools.
The quiz is subject generic; it is worth noting that unlike the tailored course that Pathway B delivered to different modules, Pathway C is a more generic offer, and some guidance has been removed to avoid confusion.
Results and Discussion
The total view count figures for Study Block 2 (SB2) show a substantially increased percentage reach for most videos compared to the original figures from SB1. Percentage reach is a key metric in this study as it measures successful delivery of videos to students. Table 1 demonstrates a highly successful outcome, showing that a higher percentage of students viewed most of the guidance videos in SB2 than in SB1.
In SB1 the sample of 2000 students watched an average of 0.79 videos each, which increased to 2.13 videos per student in SB2 with a sample size of 196. This increased percentage reach shows a successful improvement in reaching students using the new pathways.
Table 1: Total view count comparison between SB1 and SB2
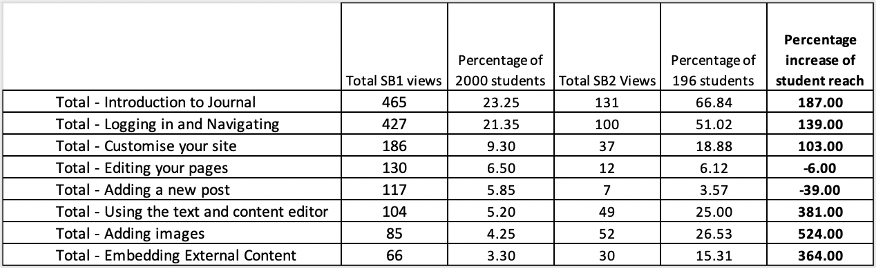
Table 2: Share of video views across Pathways A, B and C
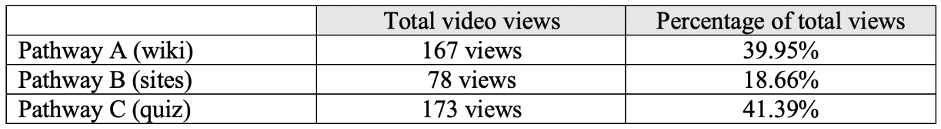
Pathway C had the largest share of the view counts at 41.39%. Pathway A had a slightly lower but similar share at 39.95%. Adding Pathway C to the VLE environment is clearly the main contributing factor to the increase in engagement with the videos, being responsible for the largest share of views, and inserted at the earliest moment in the student journey. However, views for Pathway A and B also increased from SB1 to SB2.
As Pathway A and B both relied on users searching for guidance, this suggests that the increased visibility of guidance in the VLE led students to identify their own knowledge gaps, prompting them to later search for and find the guidance that they knew existed. It is also possible that further inclusion of academic staff into the discussion around guidance meant that they were more likely to direct students towards it when asked.
Most popular videos
The most viewed videos overall were ‘Introduction to Journal’ (131 total views) and ‘Logging in and Navigating Journal’ (100 total views) which combined comprised 52.74% of the 438 total views. As their names suggest, these videos simply give an overview of Journal and provide a narrated walkthrough of logging in and navigating the platform. If Journal were a physical library, this is the equivalent of showing them how to use the front door and quickly walking them around without any further detail.
These are exactly the kind of baseline digital literacy skills which students are generally assumed to possess (Williams et al. 2008:168), especially actions like logging in to online systems which are relatively generic across the wider web. That students are engaging with (and seeking out) this guidance over all others seems to disagree with Angelaina and Jimoyiannis’ (2011:170-171) claim that students find blogs “easy to use”, instead supporting Sharma (2008) and Adhikari’s (2019) experiences of students struggling with the technical requirements.
Another possible reading of this data could be described by Lanclos (2016:23) who urges the importance of visually introducing spaces to students simply to welcome them in and show them around. The popularity of these videos could suggest that students simply want a tour of the system before using it.
The first month
Most views were recorded in the first month of the 5-month study. 276 out of 418 total views (66.03%) were counted before February 14th 2020.
The anticipated student behaviour of engagement with videos was that most views would be recorded in the first month when students were first introduced to Journal, with a second spike just before deadlines. To clarify, the Pathway C videos were embedded in week 1 or 2 of the modules in the VLE, introducing students to Journal as they were expected to begin using it. This adheres to Salmon’s (2002:4) good practice of online learning design by providing a considered framework for students to work through and providing information in the order that it is needed (Nilson and Goodson, 2017:79).
The anticipated pre-deadline spike was expected to show greater reliance on searching for information as it was needed (Bawden and Robinson, 2012:205) potentially reflecting students who hadn’t engaged earlier and were now ‘cramming’ work into the last couple of weeks.
Comparison of pathways
Pathway A (wiki)
Pathway A (wiki) proved to be successful, being responsible for 39.95% of all views. The two most viewed videos in the experiment were Pathway A iterations of ‘Introduction to Journal’ and ‘Logging in and Navigating’.
It could be argued that elsewhere, due to the sequencing of the Pathway C videos with these two videos first and second (and view counts predictably decreasing throughout the sequence), that their high view counts were a fluke of sequencing and not an indication of student need. However, Pathway A videos required students to search them out, and as Bawden and Robinson (2012:205) state, actively searching for information implies a need for it. The fact that Pathway A iterations of these two videos were the most viewed overall strongly supports the hypothesis of overestimated student digital literacy.
Although less pronounced than expected, an anticipated pre-deadline ‘spike’ of views did occur. This spike was exclusively observed in Pathway A videos which seems to show a student preference for traditional wiki guidance when actively seeking information.
Pathway B (sites)
Pathway B was the least successful of the three with 18.66% of the total views. This was somewhat surprising as the methodology behind this pathway seemed sound, delivering a curated instance of the guidance (Mathews, 2009:32) at point of use (Potter, 2012:4-7). However, it does reiterate findings that most students didn’t find this guidance in SB1, and that optimising it according to the literature simply wasn’t enough.
Examining reasons why Pathway B was less successful is an exercise in conjecture without further discussion with students, however relevant lessons can be found in the literature.
It is possible that the failings of Pathway B were a sign of ‘expert intuition’ (Borg and Reidsma, 2016:38) making assumptions without sufficient user consultation. It is possible that embedding guidance within Journal neglected the conventions of the wider web and it therefore became largely invisible to students (Lanclos, 2016:23).
It is possible that delivering Pathway C guidance at an earlier and more visible point in the student journey simply negated much of the need for Pathway B. The popularity of ‘Introduction to Journal’ and ‘Logging in and Navigating’ is particularly relevant as Pathway B videos were only accessible after students had logged in and navigated Journal, rendering this most popular guidance largely obsolete.
Pathway C (quiz)
Pathway C was the most successful pathway, accounting for 41.39% of the total views.
Up until the pre-deadline spike, videos included in Pathway C were always the most popular iterations, with the single exception of ‘Logging in and Navigating journal’ which temporarily had one fewer view than Pathway A on March 14th 2020.
In the first month of the study about half of the student views were recorded through Pathway C. Subsequently all Pathway C videos recorded small but steady increases until the deadline, with videos receiving between 8-12 views each over the following 4 months. It is difficult to make any valuable claims about what this means beyond the fact that despite Pathway C being generally embedded in week 1 or 2 of the VLE, some students accessed the videos at a later date. Whether this was students revisiting guidance or new students accessing it for the first time is impossible to tell.
Survey findings
How intuitive was Journal?
In the repeated student survey, over 50% of students agreed or strongly agreed that Journal was intuitive to use, and 50% agreed or strongly agreed that they didn’t need any help to use it. Removing neutral responses, this could be interpreted to suggest that less than a quarter of students reported needing access to the guidance. However 70.45% of students reported that existing guidance was helpful, and this was supported by the written feedback, suggesting that less than a fifth reported that they didn’t need the guidance.
Combining this feedback with the viewing figures – demonstrating that on average every participating student watched 2.13 videos – it seems likely that these responses included students who had first accessed the guidance, subsequently found Journal intuitive and therefore needed no further help. The potentially misleading data could be due to the limits of the research instrument, and arguably a design flaw in the questions.
Was guidance easy to find?
54.55% students agreed or strongly agreed that the technical guidance was easy to find, and only 9.09% disagreed. Regrettably this question was not included in the SB1 survey, so a direct comparison cannot be made, however these figures coupled with the view counts and positive response to the feedback are encouraging. Reflecting on the remaining 36% of students who responded neutrally to this statement, this question may have served better as a yes/no answer.
Correlating with the 9.09% (4 students) who disagreed that guidance was easy to find, 4 students gave written feedback that they didn’t find the guidance videos; “I didn’t even really know there was any”, “Not much help about, that I could find”.
Unfortunately these responses lack context that would have been available if the experiment had been undertaken with student interviews. It is possible that this is an indicator of further digital illiteracy, or of differing academic teaching methods. It would be interesting to know if these students were all on a single module, their level of engagement with the VLE, and their wider experience of using Journal, but this is beyond reach of the survey.
Coding the responses
Of the 44 survey respondents, 26 gave written feedback about their experiences of accessing the technical guidance which were coded into 4 categories.
- Guidance was helpful
- Didn’t need guidance
- Didn’t find guidance
- Guidance wasn’t enough.
These coding terms were arrived at through examination of the written responses. The word ‘helpful’ was used as it was mentioned in 5 responses and summed up the intention of the videos. The ‘guidance was helpful’ category could have been broken down into further categories of ‘easy to find’, ‘good quality’ etc., but several responses made mention of multiple positives, and would have had to be duel-categorised. Therefore ‘helpful’ was used as a blanket term for positive comments about the guidance.
Likewise, ‘didn’t/did not need’ was mentioned 4 times and was adopted to include comments that Journal was simple to use. ‘Didn’t find guidance’ incorporated comments that students didn’t know guidance existed or didn’t know where to look. ‘Guidance wasn’t enough’ refers to comments where the videos were watched, but students still found Journal difficult to use.
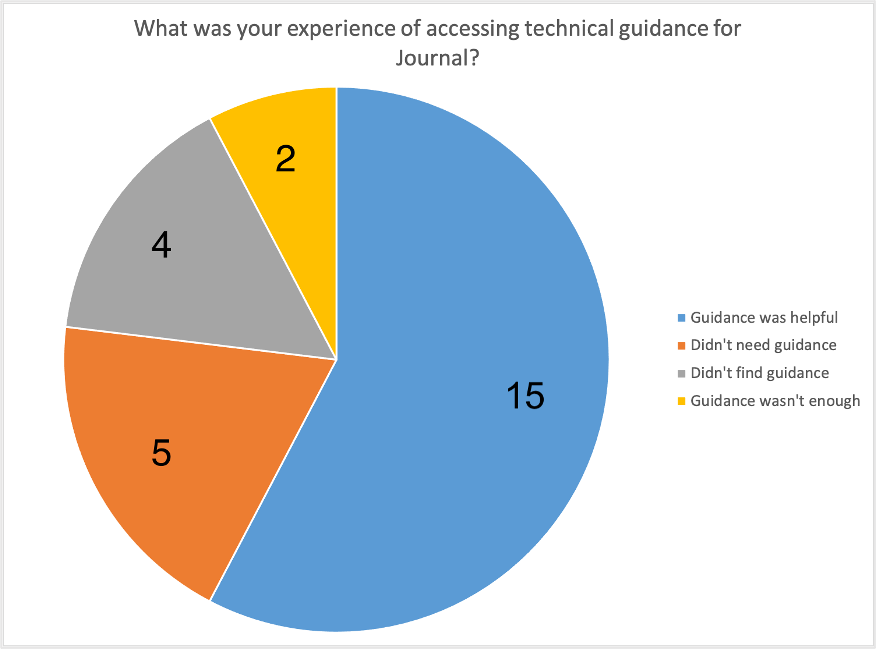
70.45% of respondents agreed or strongly agreed that existing guidance was helpful, and 57.69% gave written feedback to that effect. This is an important metric as it confirms earlier findings that guidance was appropriate to the task, and that connecting it with students was the larger issue.
2 responses indicated that Journal was difficult to use even after watching the videos: “Still a bit difficult to navigate the use of the site”, “I found it hard to navigate the site even after watching the videos”. This demonstrates a variety of levels of digital literacy and comfort in navigating University spaces (Williams et al., 2008:168, Lanclos, 2016:34) in accordance with the hypothesis of this experiment.
Conclusion
At a time when the HE sector was facing the unique challenges of the COVID-19 pandemic, the importance of effective digital tooling was suddenly more important than ever before. FU’s investment of development time into its blogging platform Journal rather than further procurement led to fertile experimentation with new ways of working with this existing tool. Although there were challenges and arguably failures in this experimentation, the process provided interesting insight into how a relatively simple tool could be conceptualised in different ways to effectively solve a range of problems.
The importance of comprehensive student guidance was identified early, but the significance of targeting it effectively was misjudged and underestimated. Examination of the literature suggested that this was widespread around blogging and online tools, which led to an in-depth research project around how this could be improved. The findings of this experiment are valid additions to the field of providing guidance for online tools. The study demonstrates the importance of considering students’ pathways to guidance, and uncovering practical and theoretical pros and cons of delivering it at different points in the student journey.
The findings strongly support the hypothesis that student digital literacy is often overestimated, and that technical guidance needs to be provided to introduce students to new online systems such as blogging platforms. The results show large increases in engagement with guidance by incorporating it into the teaching of the module, but also show continued student reliance on a central searchable wiki.
Student reliance on basic guidance videos introducing the platform and demonstrating logging in and navigating imply a continuing student need for simple, practical guidance, even when such activities follow conventions of other University systems and the wider web.
The study cannot reliably make bold claims about the value to students of engaging with the guidance, or the reduction in academic and support staff time of providing asynchronous technical guidance videos. These factors would require further study, but student survey feedback and the reviewed literature suggests that these benefits will exist.
If this study were replicated at other HE institutions, care should be taken to adapt and optimise each pathway for the relevant systems of the host institution. It was important to the integrity and practicality of the experiment that each pathway had real value to students and staff and was sustainable going forwards. The methodology of creating pathways to video guidance and recording view counts could be adapted for a variety of online tools, but the successes of this study were in large part due to a previous foundation of work undertaken on the Journal project. The data and student feedback from SB1 informed the need for the study, supplemented the instrument design, and analysis of the results and cannot be understated.
These findings, based on a study of online behaviour of creative students was undertaken at the specialist creative HE institution of Falmouth University. With the HE sector’s increased reliance on online tools due to the COVID-19 pandemic, and the likely continued increase into the future, these findings are timely and transferrable for other HE institutions and should contribute to the planning of technical guidance provision for a range of online tools across the HE sector.
About the author
Roo Pescod is a Learning Technologist at Falmouth University with a background working in university libraries and a Masters in Information and Library Studies. He specialises in educational blogging, and his research considers the user experience of HE students interacting with digital spaces.
References
Adhikari, K. (2019) ‘Examining the Role of Social Networking Fatigue toward Discontinuance Intention: The Multigroup Effects of Gender and Age’. Journal of Internet Commerce. Volume 19, 2020 – Issue 2. Available at: https://doi.org/10.1080/15332861.2019.1698265 [accessed 27 March 2021]
Angelaina, S. and Jimoyiannis, A. (2011) Educational Blogging: Developing and Investigating a Students’ Community of Inquiry. In Jimoyiannis, Athanassios (ed). Research on e-Learning and ICT in Education. New York: Springer. Available at: https://www.researchgate.net/publication/236973354_Educational_Blogging_Developing_and_Investigating_a_Students%27_Community_of_Inquiry [accessed 3 April 2021]
Arthurs, J. Drakopoulou, S. and Gandini, A. (2018) ‘Researching YouTube’. Convergence: The International Journal of Research into New Media Technologies. Vol 24, Issue 1, pp. 3-15. Available at: https://doi.org/10.1177/1354856517737222 [accessed 27 March 2021]
Asher, A. (2016) ‘Identify the barriers’. In Priestner, Andy and Borg, Matt (eds). User Experience in Libraries: Applying Ethnography and Human-Centred Design. New York: Routledge.
Bawden, D. and Robinson, L. (2012) Introduction to information science. London: Facet Publishing.
Borg, M. and Reidsma, M. (2016) ‘Holistic UX’. In Priestner, A. and Borg, M. (eds). User Experience in Libraries: Applying Ethnography and Human-Centred Design. New York: Routledge.
Bryman, A. (2008) Social Research Methods (3rd edition). Oxford: Oxford University Press.
Buckley Owen, T. (2006) Success at the enquiry desk : successful enquiry answering – every time (5th edition). London: Facet Publishing.
Case, D O. and Given, L M. (2016) Looking For Information: A Survey Of Research On Information Seeking, Needs and Behaviour (4th edition). Bingley: Emerald.
Conrad, D. (2005) ‘Building and Maintaining Community in Cohort-Based Online Learning’. Journal of Distance Education, Vol 20, pp. 1-20. Available at: https://eric.ed.gov/?redir=http%3a%2f%2fwww.jofde.ca%2findex.php%2fjde%2farticle%2fview%2f78 [accessed 27 December 2022]
Emary, Leah (2016) ’The why, what and how of using enthography for designing user experience in libraries (and a few pitfalls to avoid)’. In Andy Priestner and Matt Borg (ed). User Experience in Libraries: Applying Ethnography and Human-Centred Design. Routledge: New York.
Falmouth Digital Learning (2021) ‘Journal Short Course for Students’. Available at: https://etsupport.freshdesk.com/support/solutions/articles/4000163098-journal-short-course-for-students [accessed 15 July 2021]
Falmouth University (2020) Corporate Information. https://www.falmouth.ac.uk/corporate [accessed 4 November 2020]
Falmouth University (2021) Journal Homepage. https://journal.falmouth.ac.uk/ [accessed 9 April 2021].
Herman, E., Nicholas, D., Watkinson, A., Rodríguez-Bravo, B., Abrizah, A., Boukacem-Zeghmouri, C., Jamali, H. R., Sims, D., Allard, S., Tenopir, C., Xu, J., Świgoń, M., Serbina, G., & Cannon, L. P. (2021) ‘The impact of the pandemic on early career researchers: what we already know from the internationally published literature’. Profesional de la información, v. 30, n. 2, e300208. Available online at: https://doi.org/10.3145/epi.2021.mar.08 [accessed 26th March 2021]
Ingwersen, P. and Järvelin, K. (2010) The Turn : Integration of Information Seeking and Retrieval in Context. Netherlands: Springer.
Korthagen, F A J. (1999) ‘Linking Reflection and Technical Competence: the logbook as an instrument in teacher education’. European Journal of Teacher Education, 22:2-3, 191-207. Available at: https://doi.org/10.1080/0261976899020191 [accessed 29 March 2021]
Lanclos, D. (2016) ‘Embracing an ethnographic agenda’. In Priestner, A. and Borg, M. (eds). User Experience in Libraries: Applying Ethnography and Human-Centred Design. New York: Routledge.
Mathews, B. (2009) Marketing Today’s Academic Library: A Bold New Approach to Communicating with Students. Chicago: ALA Editions.
Mattia, C. (2015) ‘Wordpress for education’. Linked-in Learning (online). Available at: https://www.linkedin.com/learning/wordpress-for-education [accessed 6 April 2021]
Nicholas, D., Huntington, P., Jamali Hamid R., and Dobrowolski, T. (2008) ‘The information-seeking behaviour of the digital consumer : case study – the virtual scholar’. In Nicholas, D. and Rowlands, I. (ed). Digital Consumers : reshaping the information profession. London: Facet Publishing.
Nilson, L B. and Goodson, L A. (2017) Online Teaching at Its Best : Merging Instructional Design with Teaching and Learning Research. Hoboken: John Wiley & Sons.
Oblinger, D. and Hawkins, B. (2006) ‘The Myth about Students. Educause Review, vol. 40, no. 5. 12-13. Available at: https://er.educause.edu/articles/2005/1/the-myth-about-students [accessed 13 April 2021]
Pantry, S. and Griffiths, P. (2009) How to give your users the LIS services they want. London: Facet Publishing.
Pescod, R. and Redrup, S. (2021) ‘Falmouth Journal during the COVID-19 pandemic’. Educational Blogging Research. Available at: https://educationalbloggingresearch.blogspot.com/2022/08/falmouth-journal-during-covid-19.html [accessed 27 December 2022]
Pickard, A J. (2017) Research methods in information (2nd edition). London: Facet.
Potter, N. (2012) The Library Marketing Toolkit. Facet: London.
Priestner, A. (2012) ‘Case Study 21: Marketing upwards’. In Potter, N. The Library Marketing Toolkit. London: Facet.
Priestner, A. and Borg, M. (2016) ‘Uncovering complexity and detail : The UX proposition’. In Priestner, A. and Borg, M. (eds). User Experience in Libraries: Applying Ethnography and Human-Centred Design. New York: Routledge.
Ramsden, B. (2016) ‘Using ethnographic methods to study library use’. In Priestner, A. and Borg, M. (eds). User Experience in Libraries: Applying Ethnography and Human-Centred Design. New York: Routledge.
Robson, C. (2002) Real World Research: A resource for Social Scientists and Practitioner-Researchers. 2nd Ed. Oxford: Blackwell Publishing.
Rumble, G. (2001) ‘The costs and costing of networked learning’. Journal of Asynchronous Learning Network, vol. 5, issue 2. 75-96.
Salmon, G. (2002) Etivities : the key to active online learning. Oxon: Routledge Farmer.
Savolainen, R. (2005) ‘Everyday life information seeking’. In Drake, Miriam A. (ed). Encyclopedia of Library and Information Science (2nd Edition). New York: Taylor and Francis.
Sharma, P. and Xie, Y. (2008) ‘Student experiences of using weblogs: an exploratory study’. Journal of Asynchronous Learning Networks. Vol 12. Available at: https://link.gale.com/apps/doc/A284325615/AONE?u=uniaber&sid=AONE&xid=71cf1a35 [accessed on 28 March 2021]
Solon, O. (2016) ‘How Facebook plans to take over the world’. The Guardian [online]. Available at: https://www.theguardian.com/technology/2016/apr/23/facebook-global-takeover-f8-conference-messenger-chatbots [accessed 09 October 2021]
Southern, M. (2021) ‘Study Finds 4 Negative Effects of Too Much Video Conferencing’. Search Engine Journal. Available at: https://www.searchenginejournal.com/study-finds-4-negative-effects-of-too-much-video-conferencing/397301/
Stamp, Rosemary (2012) ‘Case Study 20: Effective internal marketing and communications – ten rules of success’. In Potter, N. The Library Marketing Toolkit. London: Facet.
Statista (2020) ‘How many hours in a typical week would you say you use the internet?’. Statista. Available at: https://www.statista.com/statistics/300201/hours-of-internet-use-per-week-per-person-in-the-uk/ [accessed 26 March 2021]
Statista (2021a) ‘Online activity categories carried out in the prior week the United Kingdom (UK) in 2020’. Statista. Available at: https://www.statista.com/statistics/271793/online-activities-carried-out-in-the-prior-week-in-the-united-kingdom/ [accessed 26 March 2021]
Statista (2021b) ‘Daily time spent on social networking by internet users worldwide from 2012 to 2020 (in minutes)’. Statista. Available at: https://www.statista.com/statistics/433871/daily-social-media-usage-worldwide/ [accessed 09 October 2021]
Swartz, L. (2003) Why people hate the paperclip: labels, appearance, behavior and social responses to user interface agents. MS Thesis in Symbolic Systems. Stanford University. Available online at: http://xenon.stanford.edu/~lswartz/paperclip/ [accessed 8 April 2021]
Think With Google (2018) 3 ways digital video has upended shopping as we know it. Think With Google. Available at: https://www.thinkwithgoogle.com/marketing-strategies/video/online-video-shopping/ [accessed 8 April 2021]
Tullis, T. and Albert, B. (2013) Measuring the user experience collecting, analyzing, and presenting usability metrics. Netherlands: Elsevier/Morgan. Available at: https://ebookcentral.proquest.com/lib/falmouth-ebooks/reader.action?docID=1204543&ppg=1 [accessed 5 June 2021]
Venkatesh, V., Morris, M G., Davis, G B. and Davis, F D. (2003) ‘User Acceptance of Information Technology: Toward a Unified View.’ MIS Quarterly, vol. 27, no. 3, pages 425–478. Available at: www.jstor.org/stable/30036540 [accessed 3 April 2021]
W3techs (2021) Usage statistics and market share of WordPress. W3techs. Available at: https://w3techs.com/technologies/details/cm-wordpress [accessed 9 April 2021]
Williams, P., Rowlands, I., Fieldhouse, M. (2008) ‘The ‘Google Generation’ – myths and realities about young people’s digital information behaviour’. In Nicholas, D. and Rowlands, I. (eds). Digital Consumers : reshaping the information profession. London: Facet Publishing.
WP Pluginsify (2019) ‘How to teach WordPress basics to students’. WP Pluginsify. Available at: https://wppluginsify.com/blog/teach-wordpress-basics-students/ [accessed 6 April 2021]